getwd()[1] "/Users/marten/Nextcloud/uni/vwl5/VL_Empirical"getwd()[1] "/Users/marten/Nextcloud/uni/vwl5/VL_Empirical"load("data/dataset_AJR2001.Rdata")
head(data)= cross sectional Data (no time option)
Example Plot
plot(data[, "logem4"], data[, "logpgp95"])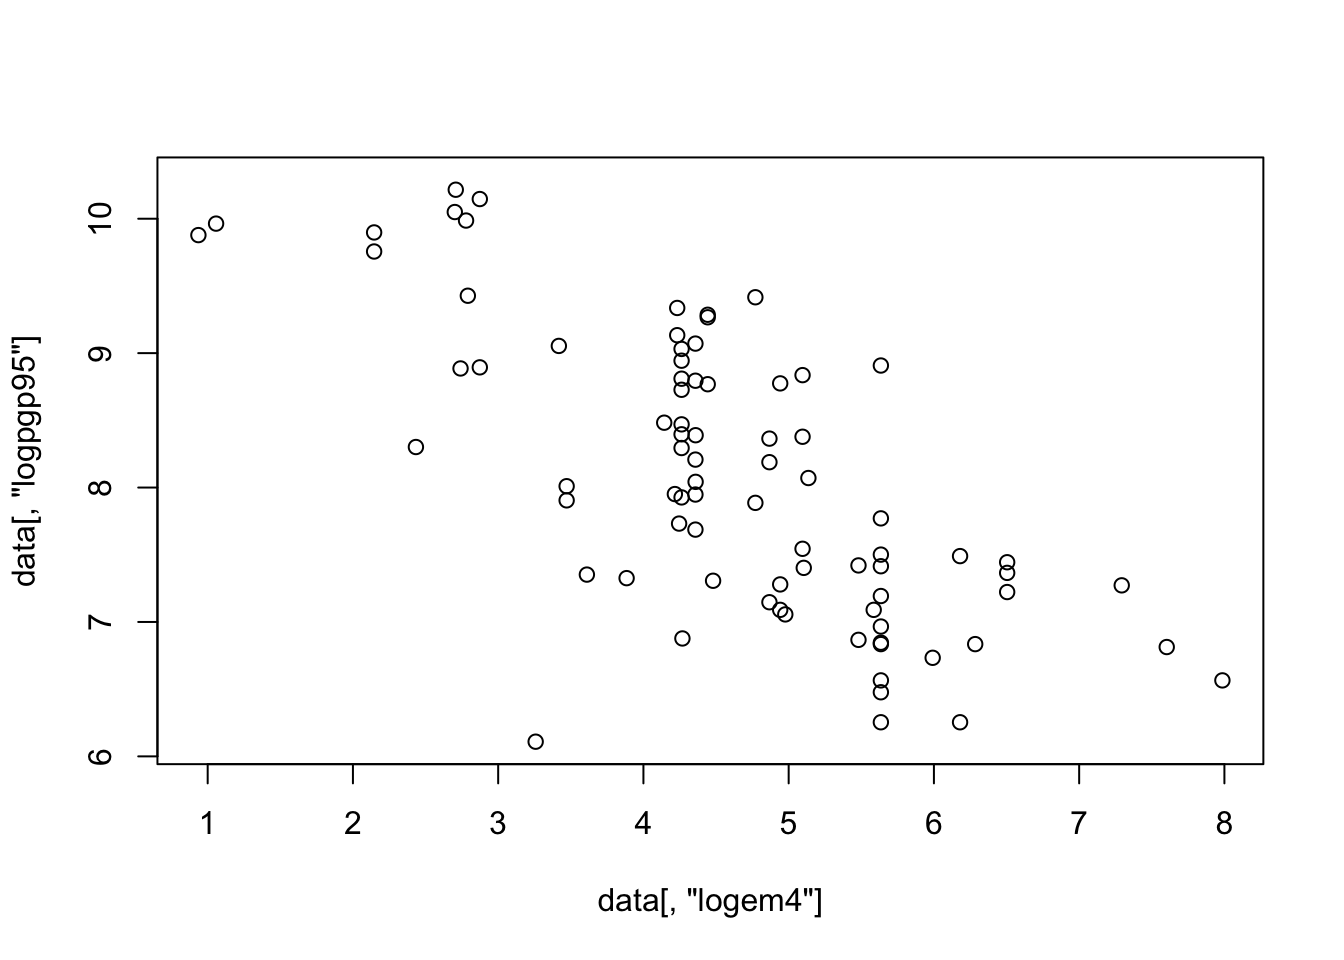
Making it prettier, note: run complete chunk at once!
#svg("data/figure1.svg") #for saving to file
plot(
  data$logem4, data$logpgp95,
  type="n", #for no plotting, to add the labels as points
  xlim=c(2,8), ylim=c(4,10.5),
  xlab = "Log of European Settler Mortality",
  ylab = "Log of GDP per Capita"
)
text(data$logem4, data$logpgp95, labels = data[, 1])
abline(lm(data$logpgp95~data$logem4))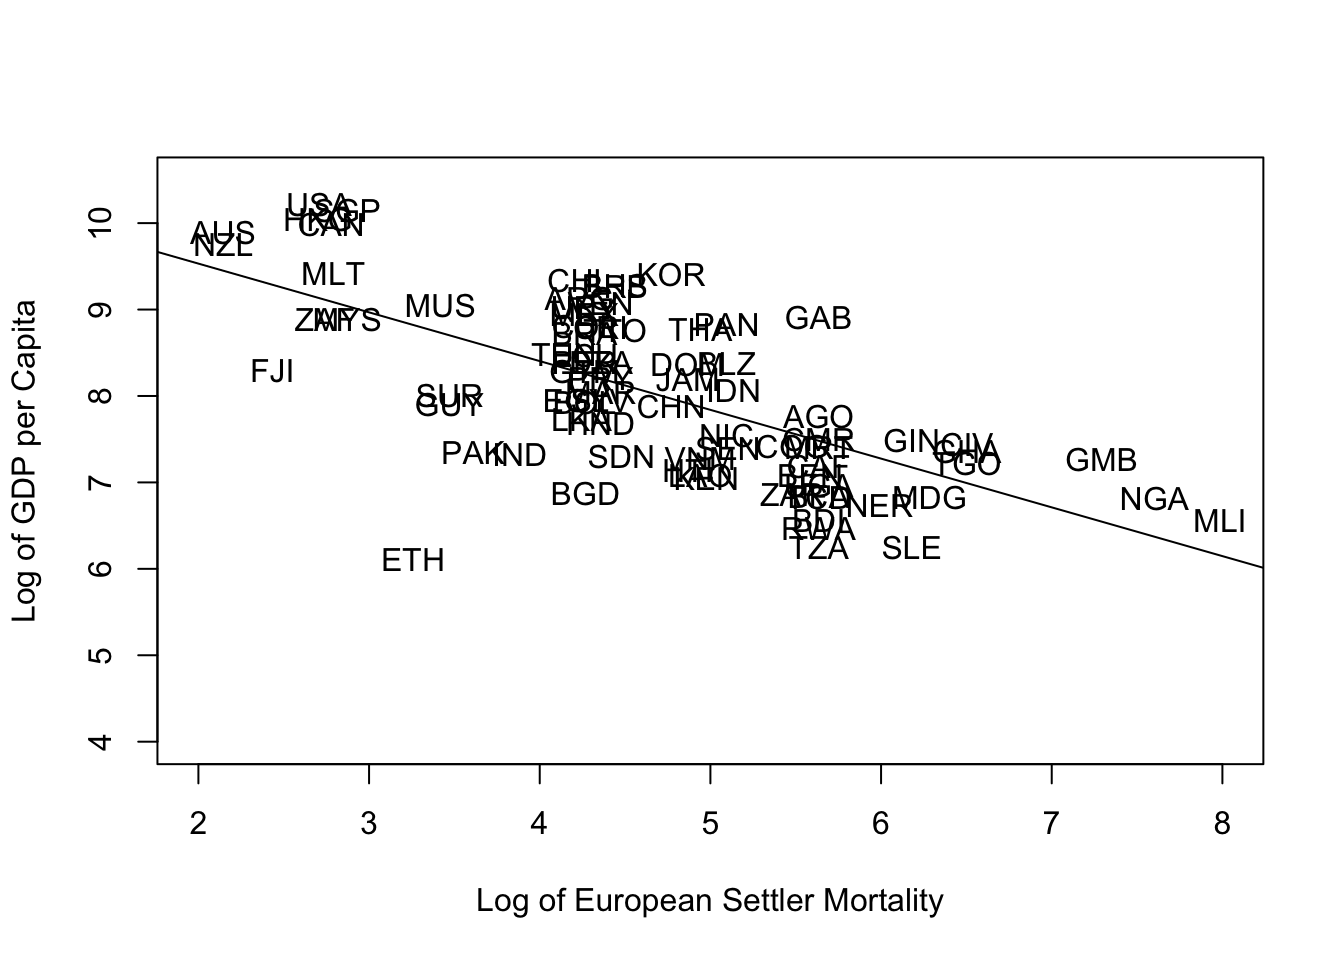
#dev.off()Loading Library
library(stargazer)Warning: Paket 'stargazer' wurde unter R Version 4.1.2 erstellt
Please cite as: Hlavac, Marek (2022). stargazer: Well-Formatted Regression and Summary Statistics Tables. R package version 5.2.3. https://CRAN.R-project.org/package=stargazer To see the resutling teble, render to HTML
Table_1 <- c("logpgp95", "loghjypl", "avexpr", "cons00a", "cons1", "democ00a", "euro1900", "logem4")

html <- stargazer(data[, Table_1], covariate.labels = c(
  "Log GDP per capita, PPP, 1995",
  "Log output per worker in 1988 (US normalized to 1)",
  "Average protection against expropriation risk, 1985-1995",
  "Constraint on executive in 1900",
  "Constraint on executive in first year of independence",
  "Democracy in first year of independence",
  "European settlements in 1900",
  "Log of European Settler Mortality"),
  type="text", #for output in text
  out="data/Table1_stargazer.html" #save the file to html
  )
Summary Statistic Table
===========================================================================================
Statistic                                                 N   Mean  St. Dev.  Min     Max
-------------------------------------------------------------------------------------------
Log GDP per capita, PPP, 1995                            148 8.303   1.105   6.109  10.289
Log output per worker in 1988 (US normalized to 1)       123 -1.731  1.084   -3.540  0.000
Average protection against expropriation risk, 1985-1995 121 7.066   1.804   1.636  10.000
Constraint on executive in 1900                          91  1.857   1.823     1       7
Constraint on executive in first year of independence    88  3.591   2.415     1       7
Democracy in first year of independence                  87  1.149   2.577     0      10
European settlements in 1900                             154 30.466  42.390  0.000  100.000
Log of European Settler Mortality                        87  4.596   1.303   0.936   7.986
-------------------------------------------------------------------------------------------